About me

Hi, I am Angel Xu!
As a recent graduate student at University of California, Berkeley, majoring in Industrial Engineering and Operations Research, I have honed my skills in turning complex data into actionable insights to solve real-world problems. Currently, I am actively seeking a full-time position as a data scientist or data analyst in the US.
My passion for data and problem-solving has led me to collaborate with Berkeley Fire Lab on a capstone project, where I am building a Wildfire Risk Assessment Framework using fire modeling data for wildland-urban interface structures in California.
You can find my project brief here.
Before starting my graduate studies, I spent my undergraduate years at Dalian University of Technology, where I studied Information Management and Information Systems in the beautiful seaside city of Dalian, China.
In my free time, I love to spend time with friends and explore new places, whether it be traveling or just checking out local stores. When I am not out and about, you can find me playing badminton or tickling the ivories on my piano. If you share any of my interests, don't hesitate to reach out. I am always looking for new friends and adventures!
Internship
- Data Scientist @Omnium
- - Time: 05/2023 – 08/2023
- - Keywords: Data Analysis, Machine Learning, Data Visualization, Excel, R, Python
- Data Analyst @Bytedance
- - Time: 02/2022 - 06/2022
- - Keywords: Statistical analysis, A/B testing, SQL
- Data Scientist @University of Victoria
- - Time: 07/2021 – 10/2021
- - Keywords: Regression Modeling, Timeseries Forecasting, Python
- Business Data Analyst @Meituan
- - Time: 06/2021 – 09/2021
- - Keywords: Data Analysis, Product Management, Tableau
- User Growth Analyst @Tencent
- - Time: 08/2020 – 12/2020
- - Keywords: Data Preprocessing, Data Visualization, R
Projects
Responsible Data Journalism amid COVID-19
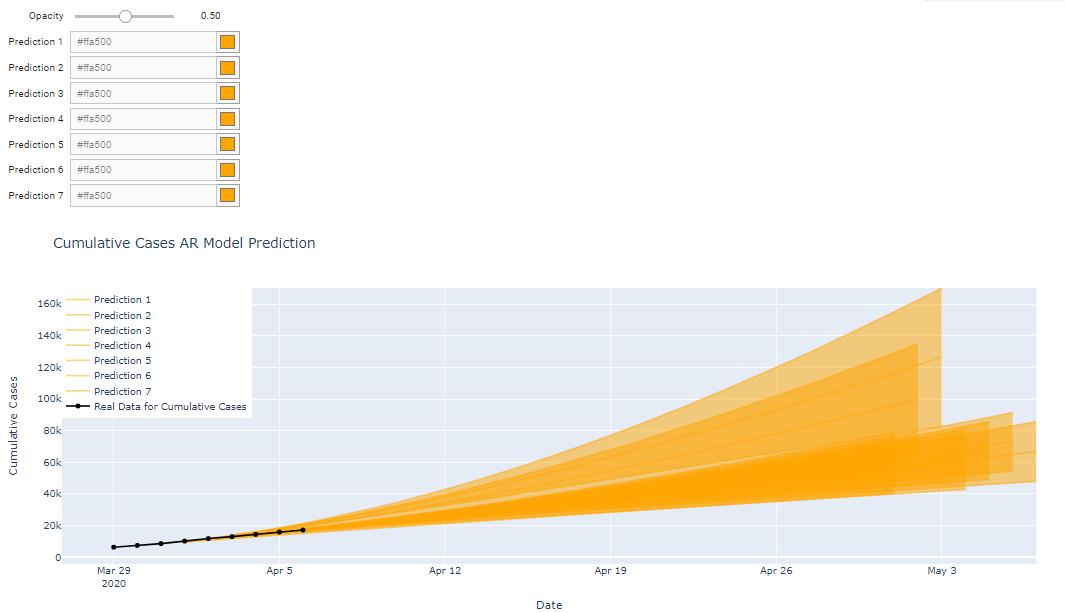
During this project, we focus on constructing infographics for COVID-19 data journalism more responsibly by conveying uncertainty behind COVID-19 data in the area of data visualization. Specifically, we investigate how pre-existing visual analytics subject to data uncertainty impacts the design of an updated, uncertain analysis when new data is available.
To create a more effective uncertainty visualization, using a COVID-19 time series data set collected from various authoritative sources, we predicted COVID-19 cumulative cases and vaccinations in Canada based on time series models. We then utilized RMSE to compare the prediction accuracy of different models and visualized the confidence intervals of prediction results and Root Mean Square Error (RMSE). We also generated the interactive chart of COVID-19 cumulative cases in Canada with Jupyter Widgets to allow users to explore more design space.
You can find project code here.
Analysis of TMDB Movie Dataset and Revenue Prediction
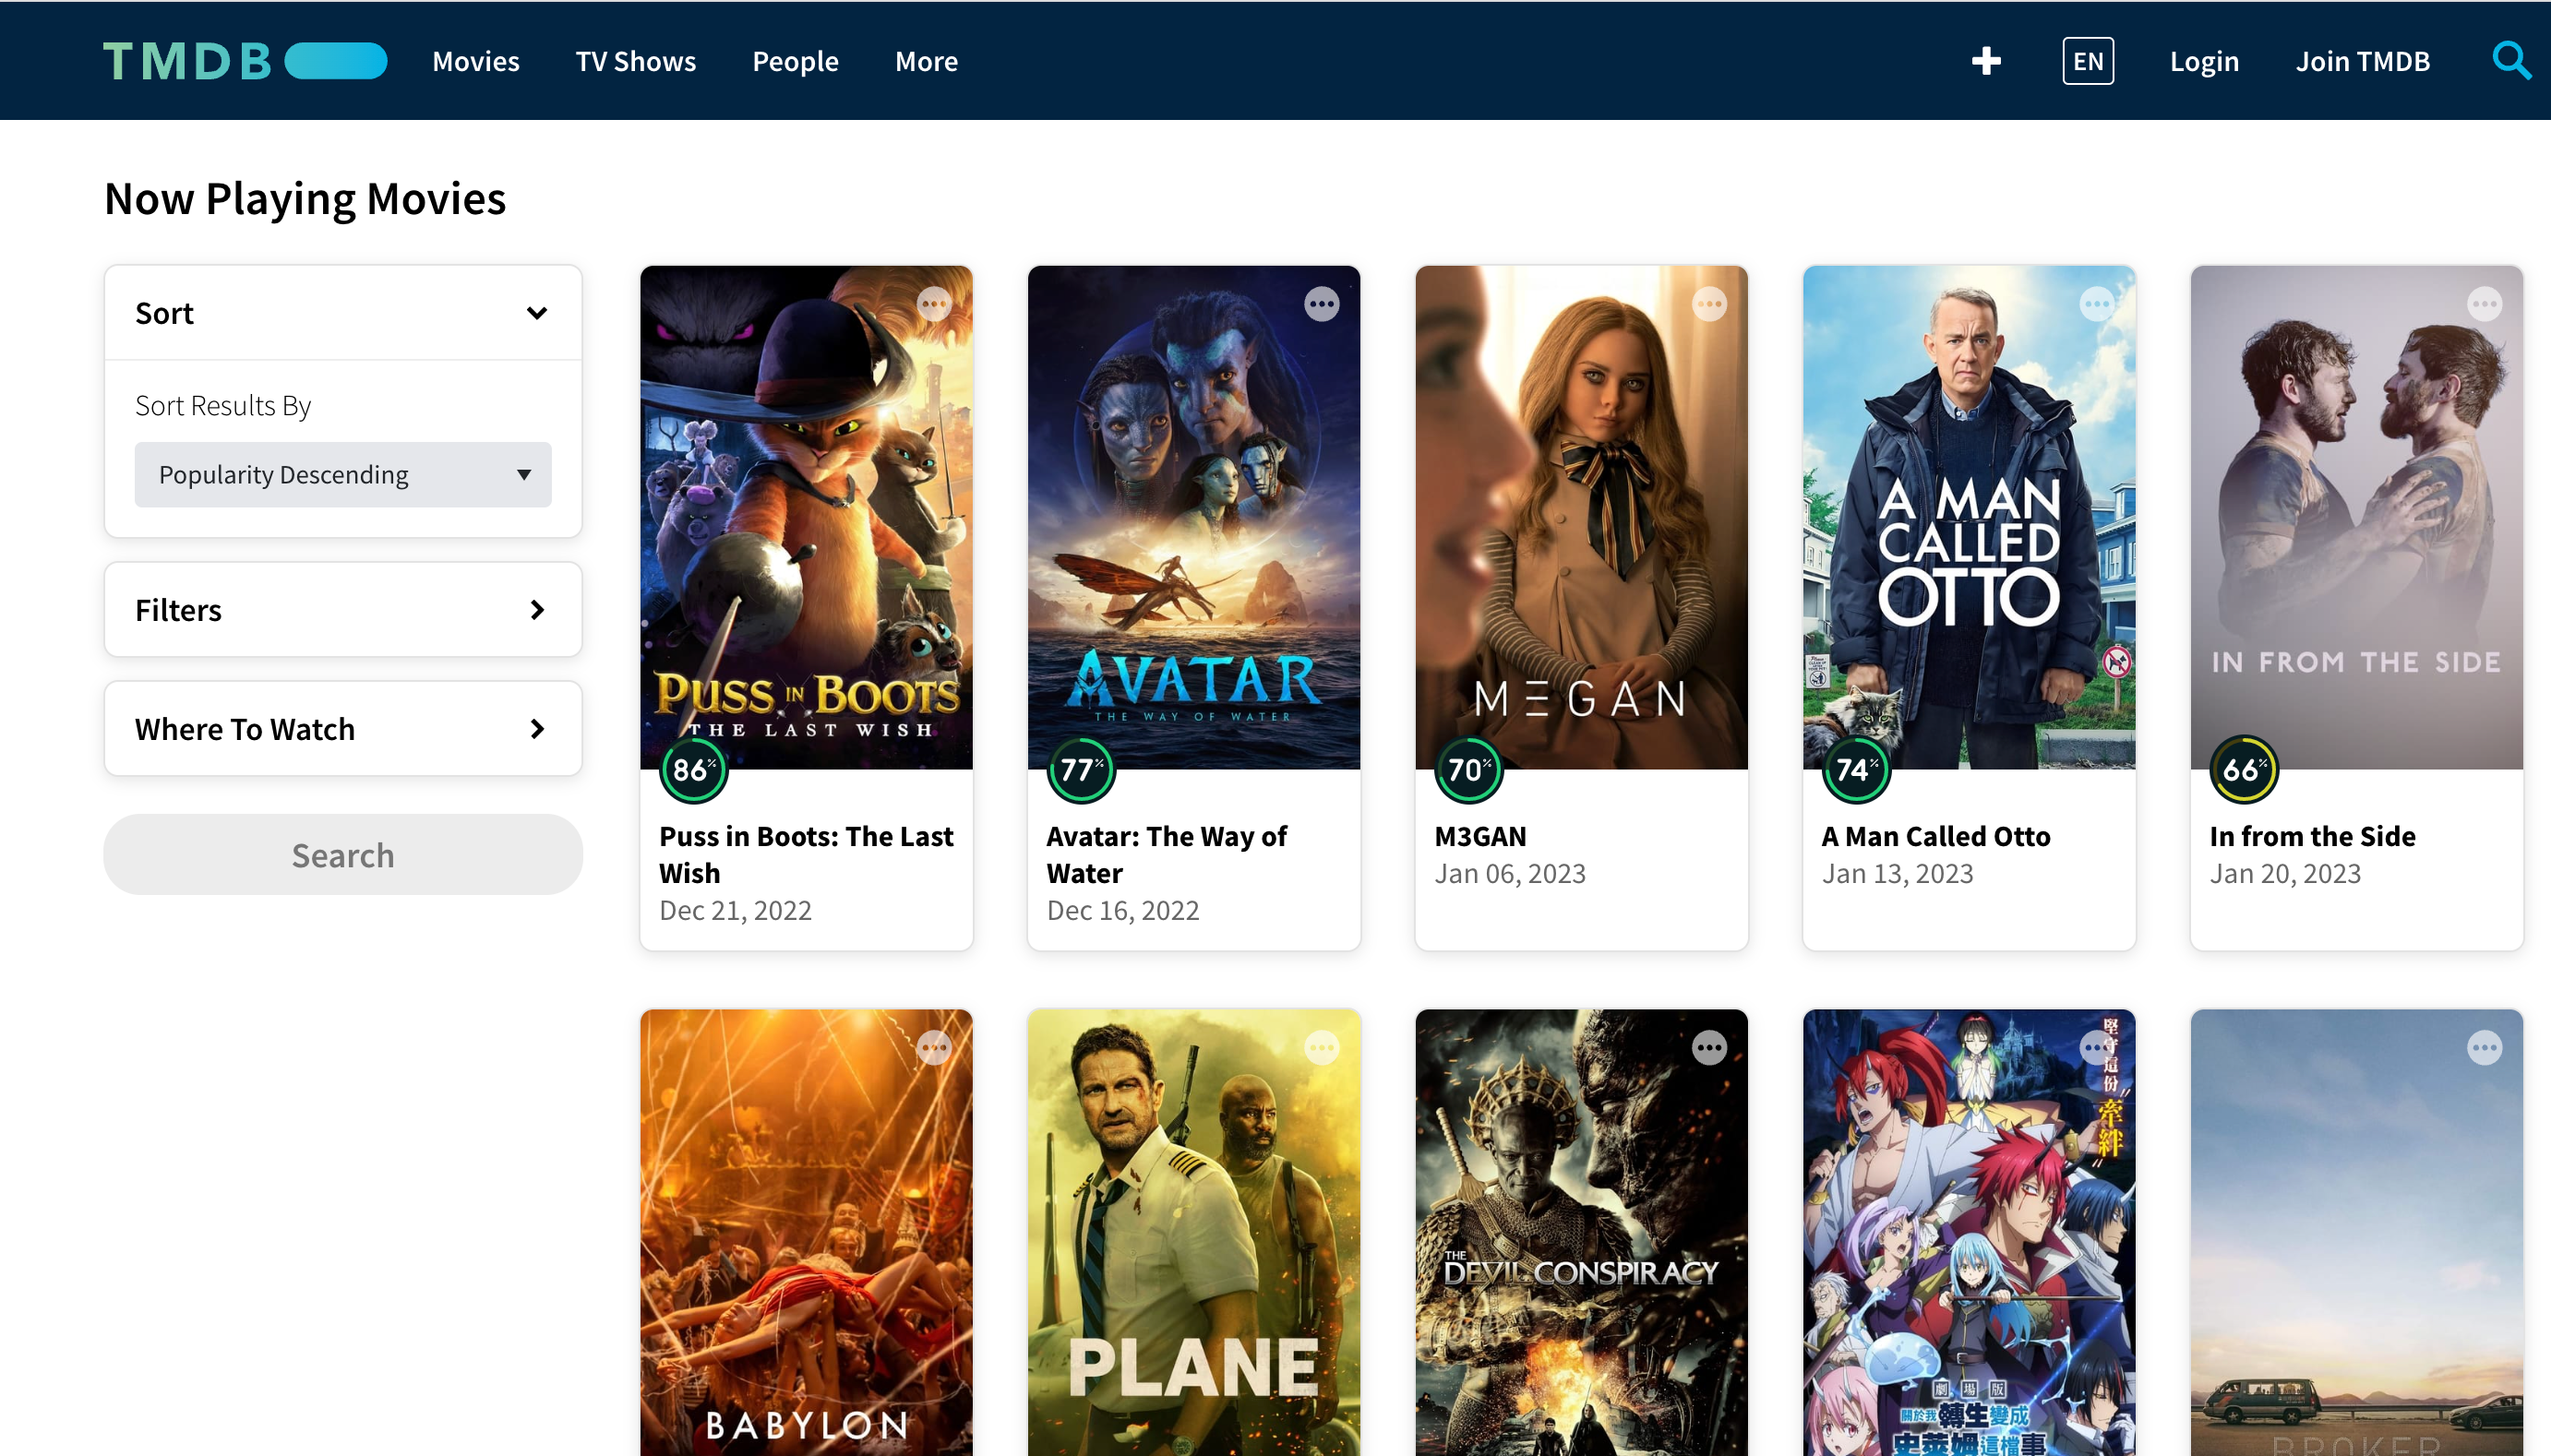
By doing this project, multiple machine learning models (CART, Random Forest, Boosting Regression) were built to accurately predict the box office revenue, which greatly informed the tough investment decision-making process when facing such a high-risk and high-yield opportunity in the film market. In addition, our prediction was highly important for advertisement companies that seek to embed their ads in popular movies. By mastering the key formula for film success, we could help film producers produce films that cater to the market and capital. Our prediction could also assist cinemas in scheduling movies and help people choose movies to watch.
You can find project code here.
Research on User Download Behavior based on Google Play App Data

We mainly used three machine learning models, namely Logistic Regression, Support Vector Machine and Random Forest, to predict the ratings of applications in the Google Play store, obtained the prediction accuracy of the three models, and finally selected the model with the highest prediction accuracy to complete the actual application for the rating prediction of the newly developed application.
We also performed text sentiment analysis on user reviews of each application, and used bag-of-words model and TF-IDF model to extract features and analyze text polarity of the text dataset respectively, so as to determine users' sentiment tendency towards a certain application, and then combine the user download quantities to derive the relationship between user review polarity and user download behavior.
Based on the above analysis, we proposed specific solutions and development suggestions for the problems existed in the development and operation process of Google Play applications.
The revival of ancient villages in Yunnan, China through big data
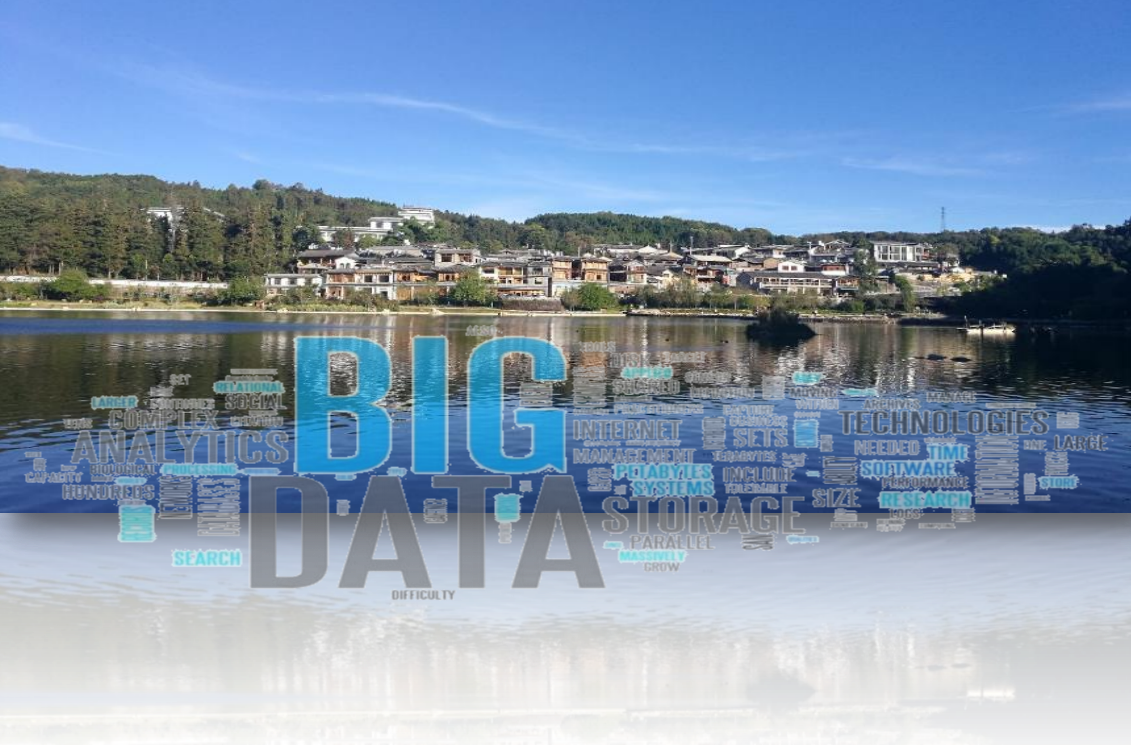
In the era of big data, network information resources have become an important means for ancient villages to expand their visibility and influence. To identify the key problem, I developed a ancient village network information resource evaluation model. I found that The digitization of ancient villages is not enough. The popularity of the villages varies greatly from one another。The local government has limited means to protect them.
In order to solve the problems above, we combined big data and ancient village protection, through a number of digital products and services to give ancient villages a new birth. First, we built a "data lake" to store a large amount of unstructured data of these ancient villages. At the front end, we established a website for the promotion of the ancient villages. The website provides a public interface for village picture resources, Wiki introduction, historical sites, legends and stories, etc. Lastly, we created an one-stop application. Its core functions include ticketing, room booking and audio guide.
You can find project presentation here.
Resume
Contact
Email:
           anqi_xu@berkeley.edu

           anqi_xu828@hotmail.com
Phone:
(+1)510-424-3509
Linkedin:
anqi-xu-berkeley
Elements
Text
This is bold and this is strong. This is italic and this is emphasized.
This is superscript text and this is subscript text.
This is underlined and this is code: for (;;) { ... }. Finally, this is a link.
Heading Level 2
Heading Level 3
Heading Level 4
Heading Level 5
Heading Level 6
Blockquote
Fringilla nisl. Donec accumsan interdum nisi, quis tincidunt felis sagittis eget tempus euismod. Vestibulum ante ipsum primis in faucibus vestibulum. Blandit adipiscing eu felis iaculis volutpat ac adipiscing accumsan faucibus. Vestibulum ante ipsum primis in faucibus lorem ipsum dolor sit amet nullam adipiscing eu felis.
Preformatted
i = 0;

while (!deck.isInOrder()) {
    print 'Iteration ' + i;
    deck.shuffle();
    i++;
}

print 'It took ' + i + ' iterations to sort the deck.';
Lists
Unordered
- Dolor pulvinar etiam.
- Sagittis adipiscing.
- Felis enim feugiat.
Alternate
- Dolor pulvinar etiam.
- Sagittis adipiscing.
- Felis enim feugiat.
Ordered
- Dolor pulvinar etiam.
- Etiam vel felis viverra.
- Felis enim feugiat.
- Dolor pulvinar etiam.
- Etiam vel felis lorem.
- Felis enim et feugiat.
Icons
Actions
Table
Default
| Name |
Description |
Price |
| Item One |
Ante turpis integer aliquet porttitor. |
29.99 |
| Item Two |
Vis ac commodo adipiscing arcu aliquet. |
19.99 |
| Item Three |
Morbi faucibus arcu accumsan lorem. |
29.99 |
| Item Four |
Vitae integer tempus condimentum. |
19.99 |
| Item Five |
Ante turpis integer aliquet porttitor. |
29.99 |
|
100.00 |
Alternate
| Name |
Description |
Price |
| Item One |
Ante turpis integer aliquet porttitor. |
29.99 |
| Item Two |
Vis ac commodo adipiscing arcu aliquet. |
19.99 |
| Item Three |
Morbi faucibus arcu accumsan lorem. |
29.99 |
| Item Four |
Vitae integer tempus condimentum. |
19.99 |
| Item Five |
Ante turpis integer aliquet porttitor. |
29.99 |
|
100.00 |